Week 12 Standout Viz – Rank Over Time
What is “Rank Over Time”?
Rank Over Time is a visual technique used to track how positions change across a set period. Rather than focusing on exact values, this method emphasizes movement, helping us see who’s climbing, who’s dropping, and who’s holding steady.
It’s perfect for scenarios like sports rankings, sales leaderboards, and performance comparisons, where the story lies in how something evolves, not just where it stands at a single moment. In this week’s case, it’s all about the shifting positions of top golfers over 23 weeks.
This week’s challenge uses data from the Official World Golf Rankings, tracking the top 20 players weekly from January to June 2025. It gives us the opportunity to show how player rankings — and potentially their performance — have changed over time.
In celebration of Father’s Day, we're spotlighting golf, a sport many dads enjoy. The dataset includes:
RANKING – Player’s world rank for the week
NAME – Full name of the player
CTRY – Player’s country
AVERAGE POINTS – Average performance points
TOTAL POINTS – Total points earned
EVENTS PLAYED – Events considered for the average
WEEK – Week number (1 to 23)
YEAR – Year of the ranking (2025)
This data allows us to explore:
Who consistently stays at the top
Who rises or falls dramatically
How players' momentum shifts week by week
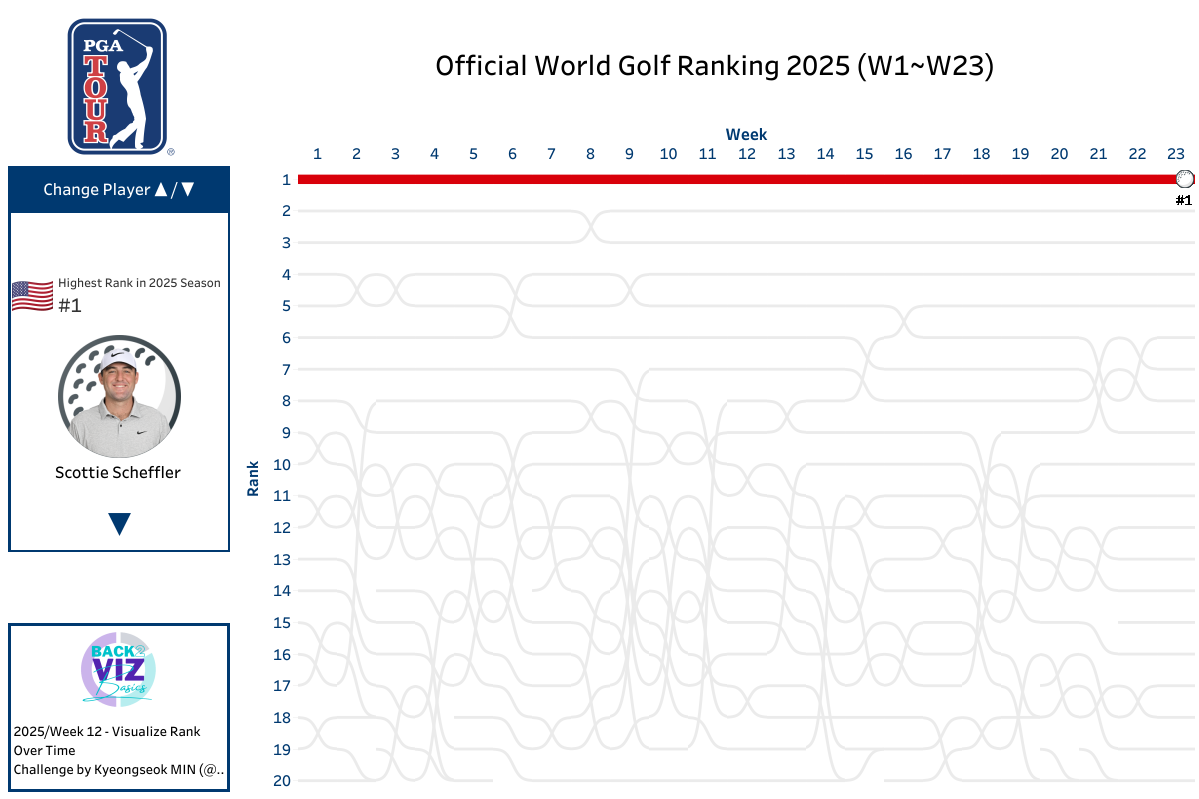
Standout Viz of the Week: Official World Golf Ranking 2025 (W1-W23) by Kyeongseok MIN
Click here to view the dashboard on Tableau Public
Why it Stands Out:
Easy-to-Follow Ranking Movement: The viz clearly shows how each golfer's position changes week by week. You can quickly see who’s moving up, dropping down, or staying consistent in the rankings.
Interactive and Engaging: It allows you to focus on individual players. When you hover or click, it highlights their journey so you can track one golfer at a time without getting overwhelmed.
Clean and Consistent Design: The color scheme is neat and not distracting. It uses soft tones that help the data stand out, making the chart easy to read.
Smooth Transitions: The lines are drawn in a way that feels almost animated. As you explore the viz, it tells the story of the rankings in a smooth, flowing way.
Want to Learn Rank Over Time?
Here are a few helpful resources to get you started with Rank Over Time:
Follow Us & Explore More
Follow Back 2 Viz Basics
Join the conversation on Twitter and LinkedIn using #B2VB
Massive shoutout to Kyeongseok MIN for creating a viz that combines precision, movement, and great UX.
See you in Week 13 — and until then, keep going beyond basic.