Week 9 Standout Viz — Viz in Tooltip
What is Viz in Tooltip?
Viz in Tooltip is one of Tableau’s most powerful storytelling tools. It allows you to embed mini visualizations inside tooltips, offering extra detail without cluttering your main dashboard. Think of it as a hidden layer of insights, when you hover over a data point, a tiny viz appears to reveal context like trends, breakdowns, or comparisons.
This technique is instrumental when you want to preserve white space or keep the dashboard minimal while still allowing users to dive deeper. It’s also a game-changer for interactivity, letting users explore multiple levels of data in one seamless experience.
Standout Viz of the Week: Hideaki Yamamoto's Digital Quality of Life Index
Click here to view the dashboard on Tableau Public
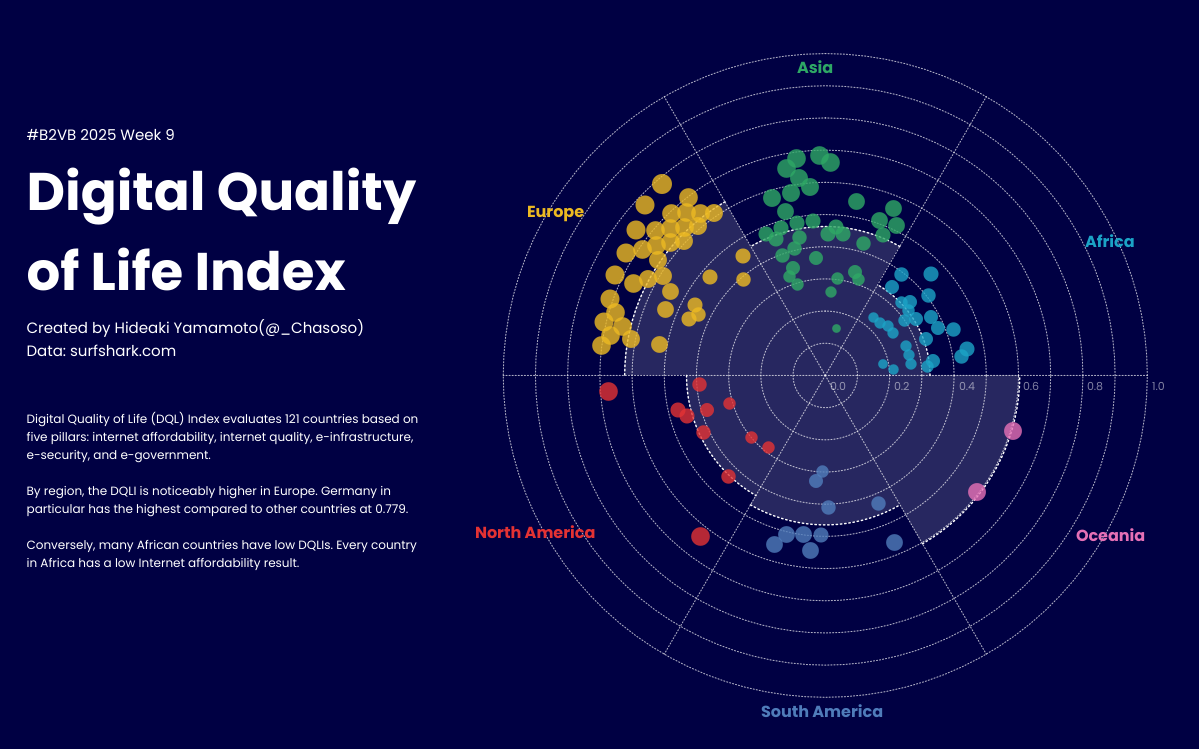
Hideaki Yamamoto, known as @_Chasoso on Tableau Public, takes the spotlight this week with an exceptionally thoughtful visualization on the Digital Quality of Life (DQL) Index. The dashboard examines 121 countries across five core pillars:
Internet Affordability
Internet Quality
Electronic Infrastructure
Electronic Security
E-Government
Why it Stands Out
This dashboard nails several elements that make a viz not just good, but great:
Beautiful Viz in Tooltip Integration: Hovering over a country reveals a breakdown of all five DQL metrics in a compact, readable format. This allows you to compare countries and dive into specific areas of digital quality instantly.
Clean Layout: The interface is sleek and breathable, avoiding data overload.
Color Use: Soft, balanced tones help draw attention without distraction. Color also supports quick visual categorization by region.
Responsiveness: The viz adapts well across screen sizes, and tooltips load quickly and clearly.
Regional Analysis: By segmenting countries by region, it becomes easier to spot disparities—such as Europe consistently leading in DQL, while African nations continue to face challenges, particularly with internet affordability.
Want to Learn Viz in Tooltip?
Here are a few helpful resources to get you started with Viz in Tooltip:
Follow Us & Explore More
Follow Back 2 Viz Basics
Join the conversation on Twitter and LinkedIn using #B2VB

