2026: Week 2 Standout Viz – Build a Line Chart
What is a Line Chart?
A line chart is one of the most effective ways to show how values change over time. By connecting data points in sequence, line charts make it easy to spot trends, rises and falls, turning points, and long-term movement in the data. They are especially useful when the goal is to understand direction, recovery, decline, or comparison across time.
Because time naturally flows from left to right, line charts help viewers quickly grasp what happened, when it happened, and how different categories behave over the same period.
About the Data
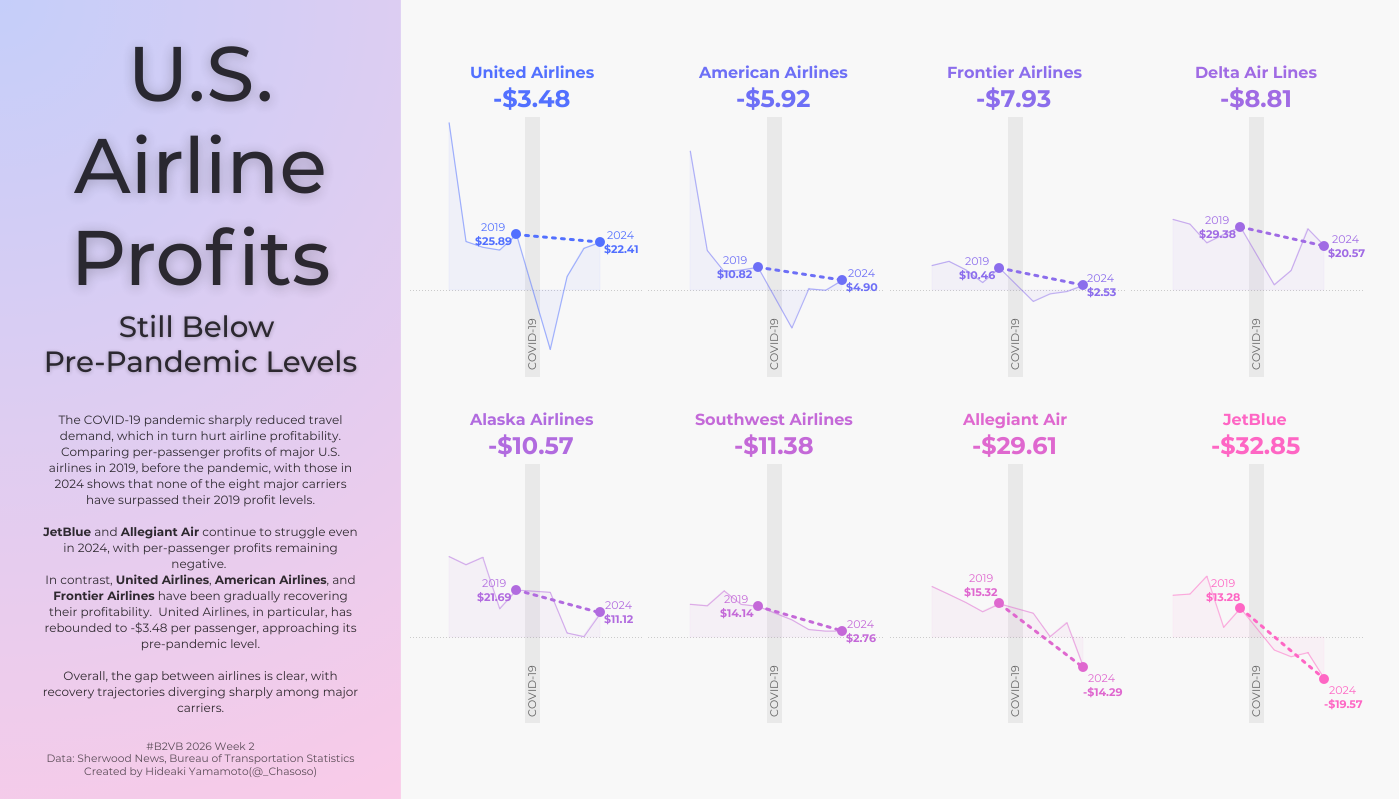
For Week 2, the dataset focuses on profit per passenger for major U.S. airlines, highlighting the impact of COVID-19 on airline profitability and the pace of recovery afterward.
The key data fields for this week are:
Year: Reporting years from 2015 to 2024 (2020 excluded)
Airline: Name of the airline
Profit per Passenger (USD): Net profit or loss per passenger, calculated by dividing total net income by the number of passengers flown
Standout Viz of the Week: Hideaki Yamamoto Top Economic Hope and Fears of Young Leaders
This week’s standout visualization uses small multiple line charts to clearly show how individual airlines were affected by COVID-19 and how each has (or hasn’t) recovered since.
Rather than combining all airlines into a single crowded view, each airline is given its own focused space, making the story easier to follow and compare.
Click here to view the dashboard on Tableau Public
Why it Stands Out
This dashboard gets several key things right that elevate it from a good line chart to a compelling story:
Clear Storytelling Through Structure: Hideaki uses small multiples to give each airline its own space, making it easy to follow individual performance over time without visual clutter. This structure helps the audience clearly see differences in decline and recovery across airlines.
Thoughtful Use of Annotations and Emphasis: Key moments, especially the COVID-19 period, are clearly marked. Subtle annotations and selective labels guide the viewer’s attention to what matters most, without overwhelming the chart.
Consistent and Purposeful Design Choices: The consistent scales across airlines allow for fair comparison, while the restrained color palette keeps the focus on trends rather than decoration. Color is used to differentiate airlines, not distract from the data.
Clean and Polished Presentation: The layout is breathable and easy to scan, balancing detail with simplicity. Overall, the dashboard feels intentional and refined, showing how line charts can clearly communicate change over time when designed with care.
Here are a few helpful resources to get you started with A Line Chart:
Follow Us & Explore More
Follow Back 2 Viz Basics
Join the conversation on Twitter and LinkedIn using #B2VB