Back 2 Viz Basics
About the project
Wherever you stand in your Tableau or Data Visualization Journey, this project is here to help you practice some of the basics to help you form or rebuild that foundation.
Getting started with Tableau can pretty daunting. As someone who never had any formal Tableau or design training, I know how hard it can be to find good tutorials or initiatives in the community that are meant for those just starting out. Back 2 Viz Basics was created to help solve that problem. I wanted to create a community project that lends itself to helping those who are newer in the community and just starting out with Tableau. That’s not saying that this initiative is only limited to newbies; plenty of us oldies could use a few refreshers on how to built clean, crisp charts. In fact, we probably have quite a few tricks up our sleeves to help some of the newer folks in the community.
Project Structure
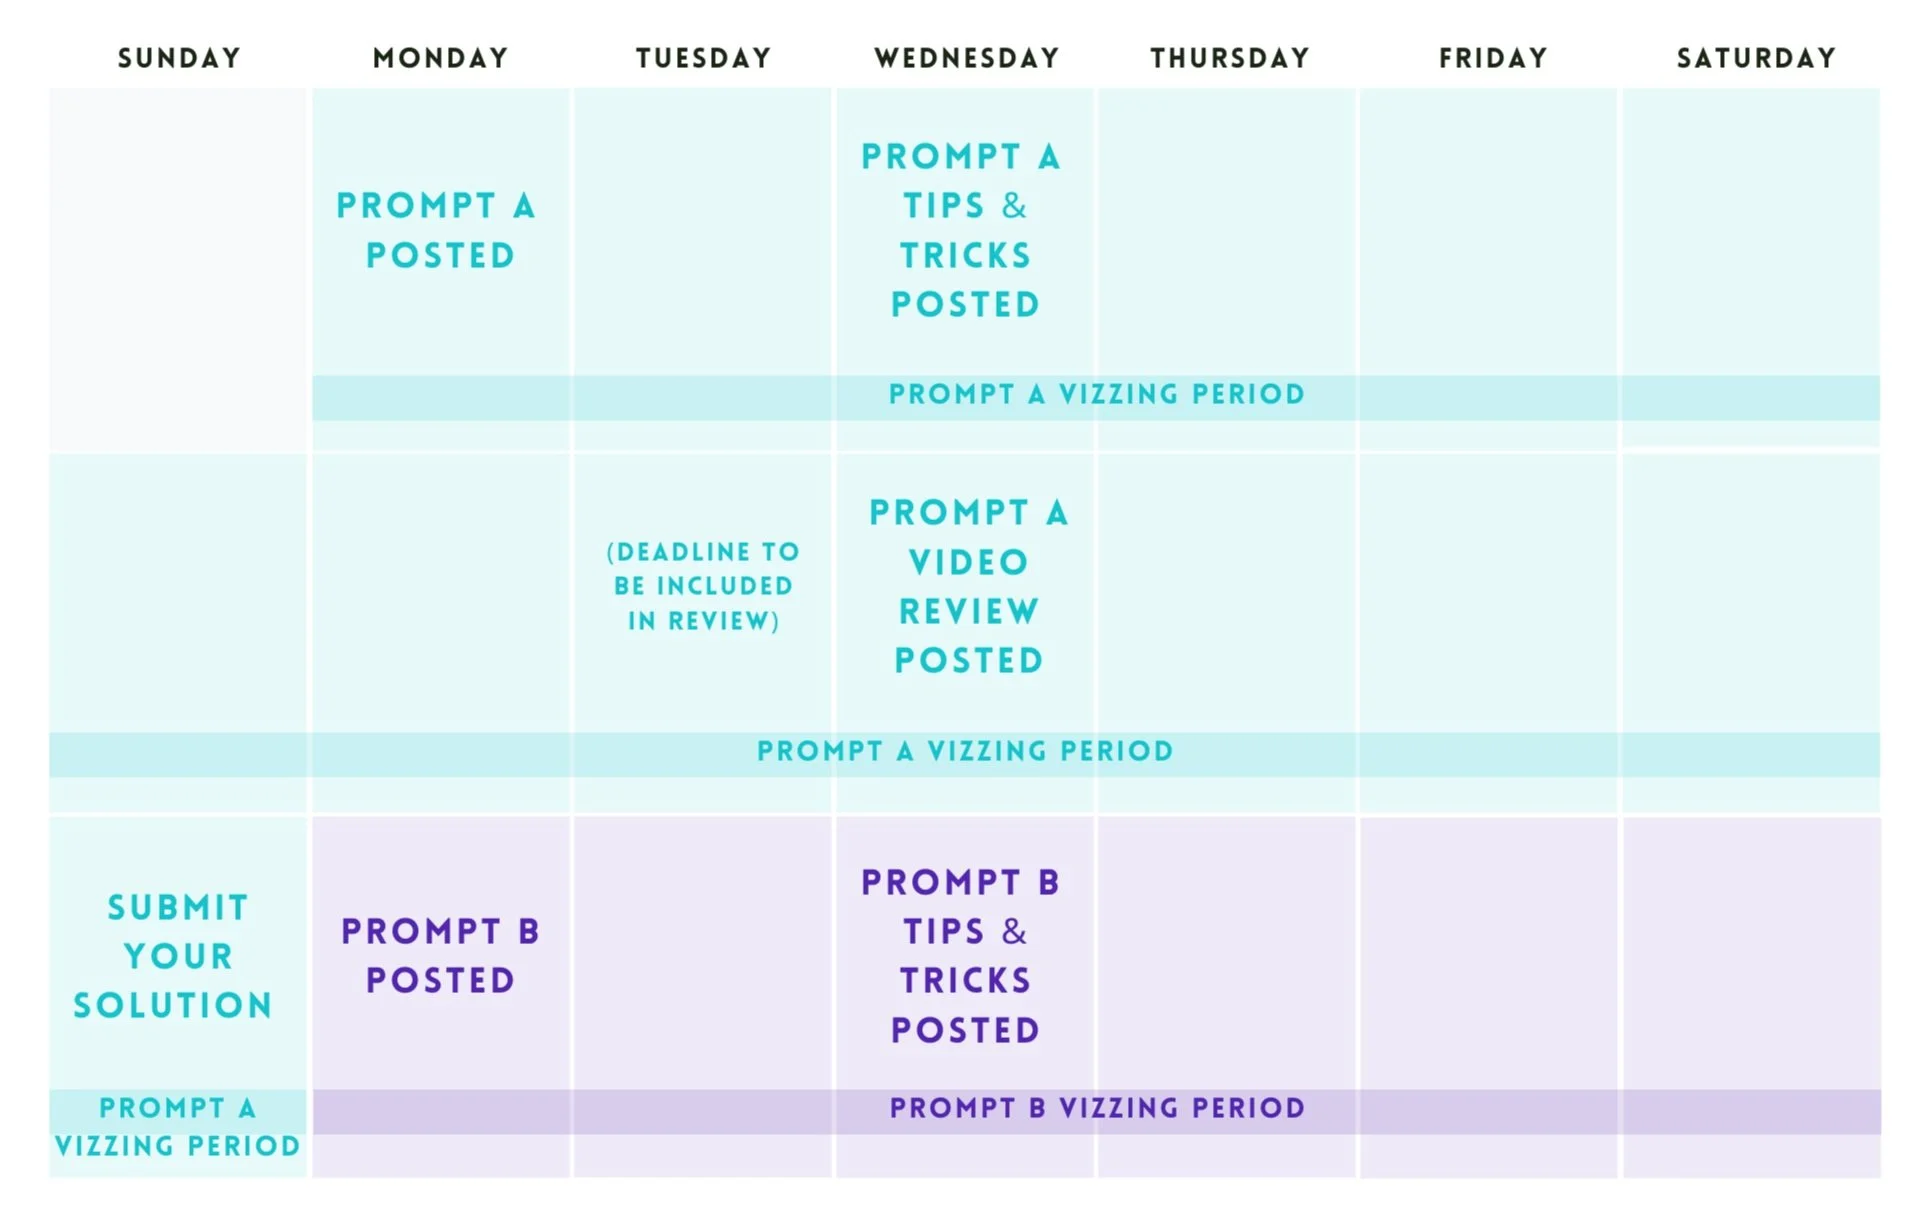
Back to Viz Basics will be run on a bi-weekly basis (every other week). The data set or prompt will be released every other Monday. Contributors will have two weeks to participate - build your viz, complete the questions, design a mock-up, etc. Tips & Tricks will be shared, a review will be posted, and submissions will be tracked. The cycle repeats.
Monday Week A: Data set/prompt released
Monday Week A - Sunday Week B: Participants complete the challenge and submit their entry
Wednesday Week A: Tips & Tricks are posted
Wednesday Week B: Video Review posted
Monday Week C: The Cycle Repeats
How to Participate
Follow us on Twitter (X), LinkedIn, and/or data.world so you will be notified when we post the weekly challenges.
Eric Balash: @ReadySetData
Elisa Davis: @ItsElisaDavis
Shreya Arya: @datavizfairy
Read the prompt - each week will be different so you need to determine the tool best needed to solve the problem. Don’t worry! I will give you a few suggestions.
Viz, doodle, type, draw - Complete the prompt!
When you are finished, please submit your contribution in the submission tracker below. This allows us to finds things a lot quicker than searching through Twitter or another medium.
Share your results! Post to Twitter, Tableau Public, or LinkedIn using the hashtag #B2VB and tag us in your post so we’re sure to see it and can reshare it with the community.
Challenges
2024 Challenges:
Week 1 - January 8 - Build a Line Chart
Week 2 - January 22 - Build a Scatter Plot
Week 3 - February 5 - Build a Text Table
Week 4 - February 19 - Build a Bar Chart
Week 5 - March 4 - Play with Size
Week 6 - March 18 - Design Insightful BANs
Week 7 - April 1 - Build a Symbol Map
Week 8 - April 15 - Create a Percent of Total Chart
Week 9 - April 29 -
Week 10 - May 13 -
Week 11 - May 27 -
Week 12 - June 10 -
Week 13 - June 24 -
Week 14 - July 8 -
Week 15 - July 22 -
Week 16 - August 5 -
Week 17 - August 19 -
Week 18 - September 2 -
Week 19 - September 16 -
Week 20 - September 30 -
Week 21 - October 14 -
Week 22 - October 28 -
Week 23 - November 11 -
Week 24 - November 25 -
Week 25 - December 9 -
SUGGESTION BOX
Is there a topic you’d like to focus on or get more practice in? Do you have a data set that you’d like us to use for a future challenge? Drop a suggestion, data set, or link to something that you’d like us to incorporate in the form below: